Chapter 11: Creating a menu of controls (don't choose yet)
11.1 What are controls?
Controls are the set of all those things that you do to reduce the risk of harm by reducing the likelihood of harm, that is, by making it less likely that a hazardous event will occur, or by reducing the severity of any harm that might result from the hazardous event (or both).
11.2 The HSE baseline
In Chapter 6 we looked at the third step in the HSE risk assessment process, ‘Control the risks.’ Resisting the temptation to haggle with the term ‘risks’ (risk is measured not counted, so I’d prefer ‘Control risk’) the description given for ‘Control’ is more informative than the one we discussed for ‘Assess’ in Chapter 5.
The HSE provide the following useful advice as shown in Box 11.1.
Box 11.1: HSE explanation of 'Control the risks'
First published on HSE website in 2019 and still present at time of writing in 2024.
Look at what you’re already doing, and the controls you already have in place. Ask yourself:
- can I get rid of the hazard altogether?
- if not, how can I control the risks so that harm is unlikely?
If you need further controls, consider:
- redesigning the job
- replacing the materials, machinery or process
- organising your work to reduce exposure to the materials, machinery or process
- identifying and implementing practical measures needed to work safely
- providing personal protective equipment and making sure workers wear it
The first line reinforces the lessons in Chapter 6 that you should have statutory controls in place before you start assessing the risk. The second bullet point reminds us of the iterative nature of risk assessment described in Chapter 5 – when you assessed, you had to consider what controls were in place, and in considering controls, you are re-assessing the risk for each option.
The first two bullets in the list of further controls point to changes in the job requirements – making it easier to do it right and to stay safe. But redesigning a job, changing your procurement process to buy different substances, or replacing equipment all involve the co-operation of other departments and investment of resources. Too often the people doing risk assessment can’t control these things. So they add as controls the only things they do have control over – more documentation, more training or more PPE. This chapter and Chapter 12 provide tools to demonstrate to those other departments, and the people holding the purse strings, that effective controls need teamwork.
11.3 The legal basis for control
Without using the word ‘control’ in relation to risk, the Health and Safety at Work (HSW) Act has a strict requirement to ‘ensure, so far as is reasonably practicable, the health, safety and welfare at work of’ employees and persons other than employees.’ We looked at the origins of ‘Reasonably Practicable’ in Chapter 5.
The term ‘ensure’ implies that the responsible person (eg the employer or person responsible for a premise) has control over the factors that guarantee safety, health and welfare at work. Case law supports this interpretation.
In R v Chargot and others (2008) the defendants tried to argue that the prosecution needed to ‘identify and prove particular acts or omissions consisting of a failure or failures to comply with the duties’ of the HSW Act. Chargot’s defence argued that the presumption of innocence should apply. However, the Court of Appeal and the House of Lords agreed that when someone has been harmed, the burden of proof moves to the employer to demonstrate that either the hazard was not reasonably foreseeable (see Chapter 1) or if it was, the employer did everything reasonably practicable to prevent harm. This obligation ‘to ensure’ means that employers and other duty holders must control risk unless they can prove it would not be reasonable to do so. If someone is harmed, risk was not controlled, so the burden of proof moves to the employer to prove that it would have been unreasonable to have any more control.
Both the HSW Act and the subsidiary legislation such as the Workplace (Health, Safety and Welfare) Regulations provide multiple examples of controls, albeit these are be described as measures, arrangements or provisions. Chapter 6 listed some of the prescriptive requirements for controls (such as keeping noise exposure below a stated level of decibels) but much of what is in the HSW Act needs interpretation. For example, this list in Section 2(2) of the HSW Act:
(a) the provision and maintenance of plant and systems of work that are, so far as is reasonably practicable, safe and without risks to health;
(b) arrangements for ensuring, so far as is reasonably practicable, safety and absence of risks to health in connection with the use, handling, storage and transport of articles and substances;
(c) the provision of such information, instruction, training and supervision as is necessary to ensure, so far as is reasonably practicable, the health and safety at work of his employees;
(d) so far as is reasonably practicable as regards any place of work under the employer’s control, the maintenance of it in a condition that is safe and without risks to health and the provision and maintenance of means of access to and egress from it that are safe and without such risks;
(e) the provision and maintenance of a working environment for his employees that is, so far as is reasonably practicable, safe, without risks to health, and adequate as regards facilities and arrangements for their welfare at work.
We can’t put a control system in place without considering ‘so far as is reasonably practicable’ (SFAIRP). Chapter 5 provided the background to this, and once we have considered the ‘menu’ of controls available to us, we will return to the subject of ‘reasonably practicable’ and what ‘grossly disproportionate’ means. However, we often consider RP too early, dismissing controls as impractical before we have considered the ‘menu’ of controls available to us. We will return to consider what is ‘reasonable’ and ‘practicable’ and what is ‘grossly disproportionate’ in Chapter 12.
Regulation 4 of the Management of Health and Safety at Work (MHSW) Regulations requires employers to use specific principles in determining control measures. These are listed in Schedule 1 of MHSW:
(a) avoiding risks;
(b) evaluating the risks which cannot be avoided;
(c) combating the risks at source;
(d) adapting the work to the individual, especially as regards the design of workplaces, the choice of work equipment and the choice of working and production methods, with a view, in particular, to alleviating monotonous work and work at a predetermined work-rate and to reducing their effect on health;
(e) adapting to technical progress;
(f) replacing the dangerous by the non-dangerous or the less dangerous;
(g) developing a coherent overall prevention policy which covers technology, organisation of work, working conditions, social relationships and the influence of factors relating to the working environment;
(h) giving collective protective measures priority over individual protective measures; and
(i) giving appropriate instructions to employees.
Ask yourself:
How often do you read through these options when generating suggestions for controls in a risk assessment?
Some items, such as (f) are probably considered under the more concise heading ‘substitution’ but how often do you think about (e) adapting to technical progress?
When you do your next risk assessment, could you read through this list to see if it prompts any more ideas?
11.4 What the research tells us - and how it is still ignored
A great piece of research published by the HSE in 2003 (RR151) describes some key errors repeatedly made in risk assessments. Three errors I see frequently stood out to me from this research:
- Carrying out a risk assessment to attempt to justify a decision that has already been made.
- Failure to identify all hazards associated with a particular activity.
- No consideration of ALARP or further measures that could be taken.
Examples of all three errors appeared during the lockdown period of the COVID-19 pandemic in the UK. In Chapter 3 we looked at how to use a flowchart to unravel the hazard elements, considering the chain of events needed to spread infection. Here, we will look at what went wrong with the controls. Think through the next exercise.
Ask yourself:
Take a look at Table 11.1, showing part of a template provided to assist organisations to do ‘COVID-19 risk assessments’.
a. Does each hazard listed meet the definition ‘anything that may cause harm’?
b. For each hazard listed, what control is suggested by the description?
c. Which of the three errors listed has this template made?
| Hazard as defined in risk assessment | Control measure |
|---|---|
| Getting or spreading coronavirus by not washing hands or not washing them adequately | |
| Getting or spreading coronavirus by not cleaning surfaces, equipment and workstations | |
| Contracting or spreading the virus by not social distancing | |
| Poor workplace ventilation leading to risks of coronavirus spreading |
In answer to my three questions:
a) I don’t have a problem with the template wrapping in the consequence (getting or spreading coronavirus) with the hazard. But the hazard is not ‘not washing’, ‘not cleaning’, ‘not social distancing’. The hazard is the virus.
b) We’ll answer this in Section 11.9.5.
c) All three errors:
- Decisions had already been made that personal and workplace hygiene, distance and ventilation were the appropriate controls, and this risk assessment would reinforce that.
- The template did not encourage organisations to identify and assess the hazards of introducing the required controls. For example, would one-way systems introduced to enforce social distancing increase fire evacuation times? Would introducing face masks reduce visibility, leading to other accidents?
- With errors 1 and 2 in place, other measures for controlling the virus, or for controlling reasonably foreseeable hazards created by the measures suggested were unlikely to be considered.
Disappointingly, this template was not some marketing download from a cut-price risk assessor trying to win business, but part of the guidance provided by the HSE, the same regulator that produced such excellent research on the errors in 2003.
In Chapter 1 and Chapter 2 I raised my concern with poorly defined hazards. The COVID-19 risk assessment was not unique in defining the hazard as the lack of a pre-determined control. Here are some examples, linking the poorly defined hazard with poorly considered controls:
- Defining ‘failing to wear PPE’ as the hazard dictates that the control should be PPE, rather than something that reduces the risk at source (such as quieter machinery, less corrosive substances or an enclosed process).
- Defining ‘insufficient training’ as the hazard dictates that the control must be training, rather than simplifying or automating the process to reduce the reliance on skills or knowledge.
- Defining ‘inadequate signage’ as the hazard dictates that the control must be signage, rather than (as for PPE) reducing the risk at source.
- Defining ‘housekeeping’ as the hazard dictates that the control must be ‘better housekeeping’ without needing to understand the hazard. If the problem is that people leave tools on the floor, consider improving storage; if the hazard is frequent leaks that require housekeeping to mop them up, better preventative maintenance might be effective; if the hazard is that products or deliveries are left in corridors, then it sounds like better inventory management is needed.
All of these predict a control, often one which is not the best choice, without thinking about the full menu of controls available.
11.5 The menu of controls - knowing what's available
Ask yourself:
You are in a restaurant and you ask for the menu. The waiter offers you two items. You ask if that is all, and the waiter then shows you one or two more items. You ask why you can’t see all the options, and the waiter tells you ‘if you decide these aren’t good enough, we can show you some more options, but these are the easiest ones for us to prepare.’ How do you feel about making a decision?
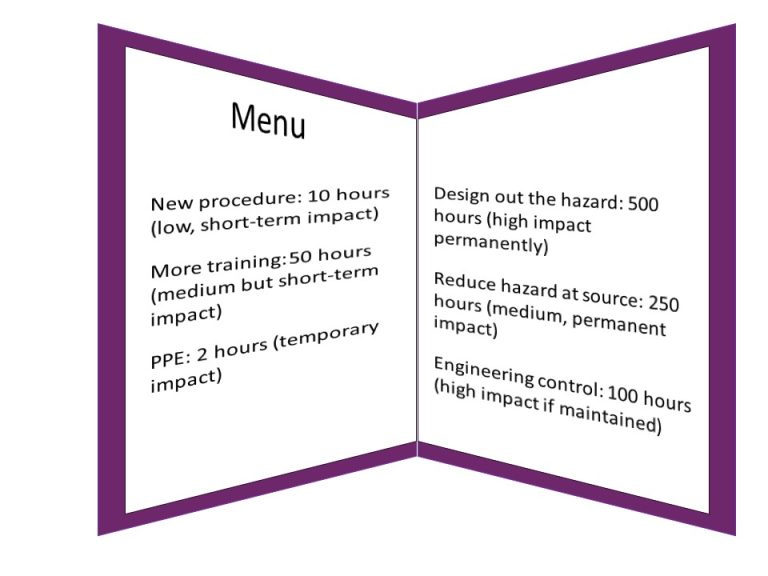
Of course, you want to see the whole menu! Until you’ve looked at all the options, and seen the prices (or perhaps the calorie count or sugar content) you won’t know which meal will give you the best enjoyment for your money (or for the calories or sugar consumed). Similarly, until we’ve considered all available controls, we can’t judge the best way to control risk, so far as is reasonably practicable.
Figure 11.1: Until you’ve looked at the whole menu, and considered likely costs and impact, how can you select the best options?
11.6 Hierarchies
In Section 11.3 we listed the ‘General principles of prevention’ from Schedule 1 of the Management regs. These principles are often referred to by some people as the hierarchy of control, although the schedule does not use the word hierarchy, nor does it imply there is an order in which to select or apply them.
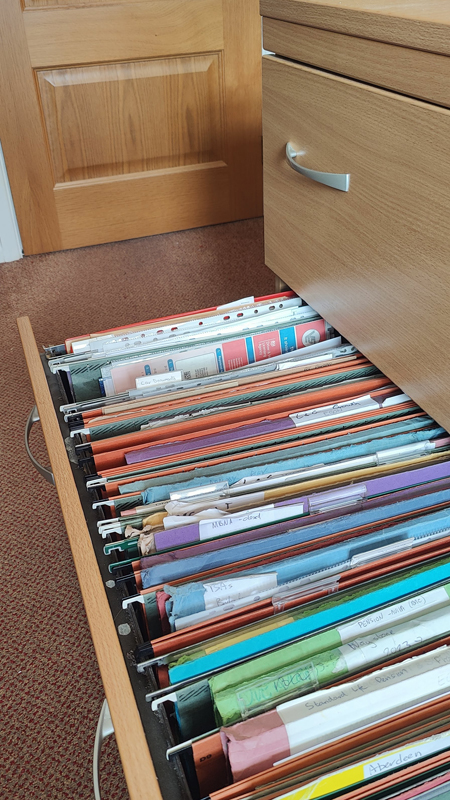

If leaving the filing cabinet drawer out could cause someone to trip and fall, is pushing it in really ‘eliminating’ the hazard?
One popular safety management course presents this ‘hierarchy’:
- Eliminate the hazard. Unfortunately, a frequently used example of this is preventing someone from falling over a filing cabinet drawer by pushing the drawer in. This is not elimination – the drawer still exists and could be left out again. Elimination would be replacing the drawers with storage that has sliding doors, or a paperless office where filing cabinets are not needed.
- Reduce the hazard. Elimination, substitution and reducing the hazard at source all get muddled up here. If I stop using bleach, and instead use an eco-friendly cleaning solution, I have eliminated bleach. I haven’t eliminated the task of cleaning. I have changed the hazard, and other control measures might still be needed for the eco-friendly cleaning solution. However, I have (probably) reduced the risk at source.
- Prevent people coming into contact with the hazard. In other hierarchies, this is given as an example of an engineering control. For example, storing flammable substances in a fire-rated cabinet, locking up cleaning chemicals, placing noisy equipment further away from busy working areas or having guards on machinery. Where these controls are statutory (see Table 6.1) they should already be in place
- Introduce a safe system of work. In other hierarchies, this is given as an example of an administrative control or a workplace precaution. Often, this focuses on procedures, rules, permits, job rotation and training. The terminology is confusing because a truly ‘safe system of work’ would start with how the task and working environment were designed, and would necessarily include elimination and prevention.
- Provide personal protective equipment (PPE). Often described as ‘the last resort’ (more on that soon) PPE is nevertheless an important additional barrier in our control system. It can include protection for hearing, eyes, the whole face, hands, feet or the whole body. A subset of PPE is RPE (respiratory protective equipment) which protects the lungs from inhaling hazardous substances when used correctly.
You might come across hierarchies with more or less detail designed to fit a mnemonic. For example:
- ERICPD – Elimination – Reduce – Isolate – Control – PPE – Discipline. I haven’t seen this recently, but it was common when I studied for my NEBOSH certificate in 2008. ‘Discipline’ was the idea that you needed to chastise people if they got it wrong. In later versions this was softened to mean training and competency. A variation ‘ERIC SP’ (Eric Saves People) had S for safe systems of work, pushing PPE to last place.
- PIGSRISE, backwards – Elimination – Substitution – Isolation – Reduction – Safe systems of work – Good housekeeping – Information, instruction, training & supervision – PPE
Describing these lists as ‘hierarchies’ can be a useful starting point to make bad risk assessments adequate, but the lists need to be unpicked to make a just-adequate risk assessment great. Let’s think first about what a ‘hierarchy’ is – see Box 11.2.
Box 11.2: Some definitions of 'hierarchy'
A ‘hierarchy’ is defined as:
- a system in which people or things are arranged according to their importance https://dictionary.cambridge.org/dictionary/english/hierarchy
- any system of persons or things ranked one above another www.dictionary.com/browse/hierarchy
- a graded or ranked series
www.merriam-webster.com/dictionary/hierarchy
The definitions in Box 11.2 share the implication of rank and importance, with the highest rank or highest importance at the top, and the least important at the bottom. This is the wrong way to think about the list of control types for two reasons:
- The nature of the first item in the list is different from all the other items in the list. If you can eliminate the hazard, you don’t need any other controls.
- Hazards are rarely eliminated. So you should consider all of the other options in the list (including PPE where relevant), and create a system that optimises all the other controls available. For example, I can find the least harmful form of cleaning substance that is still effective (reduce at source), provide a mop and barriers (engineering controls), require the job to be done out of hours (an administrative control) and instruct the cleaner on the use of gloves and aprons (PPE).
Note: In reality, when you eliminate a hazard, you don’t really stop, since in most cases you replace the hazard with something else that will need a risk assessment, but you might no longer need to control that hazard.
‘Importance’ or ‘rank’ suggests that those near the bottom of the list are not important. But often, they are critical to maintaining safety. Personal Protective Equipment (PPE) for example is described too often as ‘the last resort.’ I understand where this idea comes from – PPE relies on correct procurement, use, management, maintenance and so on. As such, you would reduce uncertainty more by eliminating the use of a substance or process that requires PPE.
For example, it is better to reduce noise levels so that we don’t rely on hearing protection. But while this might be practical in a factory, it could be less practical on a construction site.
If you have put as many of the ‘higher’ options in place as is reasonable, you might still need PPE as a last line of defence. And it might be the most effective – the most important – control you can apply.
One curiosity about this hierarchy is how often it appears as a triangle (often mistakenly called a pyramid, as if it had a 3rd dimension). Figure 11.2 illustrates a generic triangle, with eliminate at the top, and PPE at the bottom. I’ve added a thick black line to indicate that if you eliminate a hazard, you can stop, but if you don’t you might need to apply several of the measures below the line.
But is the shape misleading? Decreasing the width of each layer indicates reducing effectiveness of each control type. Eliminate will have the greatest impact on reducing risk; reducing the risk at source and engineering controls will have a greater impact on reducing risk than training, signage and PPE.
But this assumes that some measure up the triangle is always available, and always practicable. That might not be the case.
The other problem with the top-heavy triangle is that it ignores the time frame over which controls might be applied. Often, the controls at the bottom are the ones that can be applied the most quickly. Providing hearing protection as a temporary measure when their fire alarm was faulty might have saved a tanning salon a hefty compensation payment to a worker. Yes, in the following hours they needed to work out how to turn the thing off, and in the following days they should have made sure staff could turn it off themselves, but in the short term, PPE would have been incredibly effective – not a ‘last resort’ but the first resort.
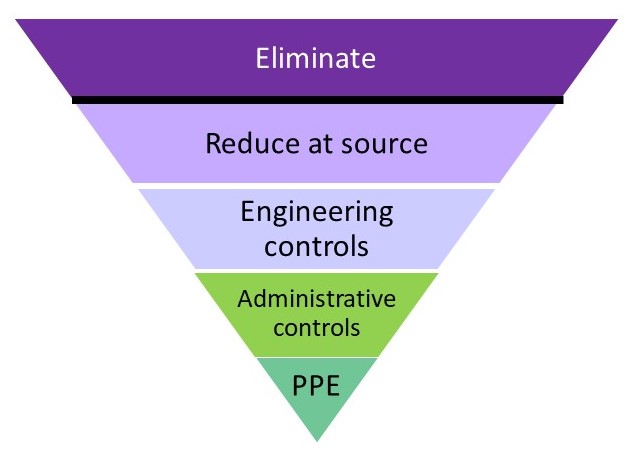
Figure 11.2: Triangle model for generic 'hierarchy' of controls
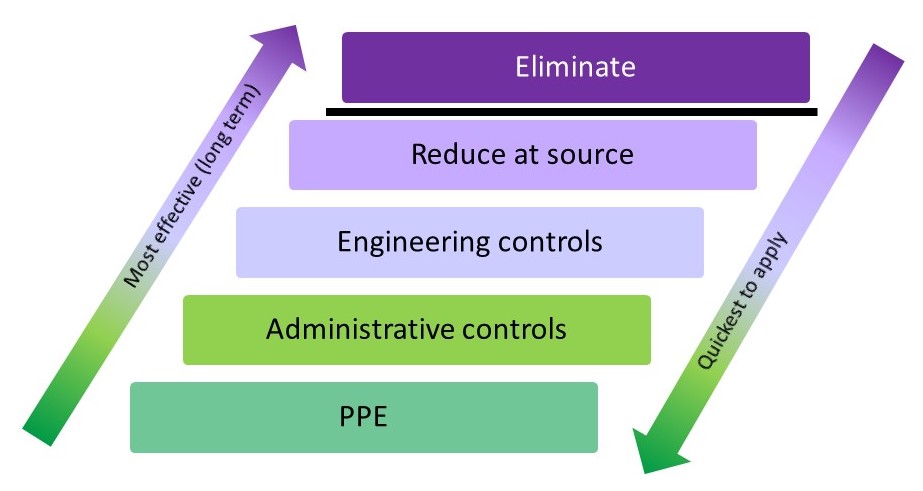
Figure 11.3: A system of controls
Similarly, imagine you have identified sharp edges on equipment. These should of course be ‘eliminated’ by repair or replacement, but in the short-term a barrier to keep non-essential staff away and requiring essential staff to wear protective gloves would be a reasonable control.
Figure 11.3 suggests another way of looking at our control options. While the items at the top of the list are likely to be the most effective to apply in the long term, you often need some short-term measures quickly to prevent harm.
These ‘hierarchies’ or lists of control types are useful as prompts for people to think about what else could be on the menu. Despite my concerns with the term ‘hierarchy’ you will find it in this book, because of the wide recognition the word has. But let’s look at other ways of expanding our menu beyond this hierarchy.
11.7 Other dimensions
Two other aspects are often considered for their impact on the effectiveness of controls:
- Prevention or protection (or mitigation).
- Individual or collective.
The work at height examples in Figure 11.4 show how these can be seen as two dimensions. Where prevention is practical it is more effective than protection. If that’s not obvious from the work at height example, think about fire. Preventing a fire from starting is a more effective way of protecting people than trying to put one out once it has started.
You can also see from Figure 11.4 that a rail around the edge of the roof is more effective than asking every individual worker to use a work restraint device correctly. Whether it is practical will depend on how often the roof is accessed, the shape of the roof and other factors.
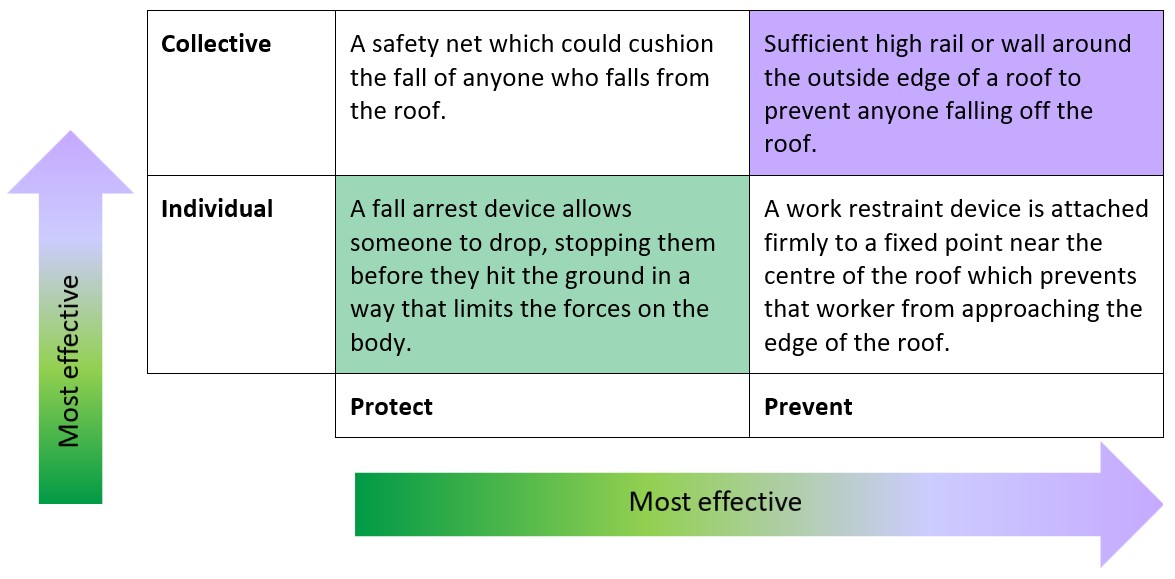
Figure 11.4: Two further dimensions of controls with work at height examples
Practicality aside, it is clear that collective, preventative controls are more effective than individual protective controls. But how to we ‘rank’ the effectiveness of the collective protective controls, or the preventative individual controls? Does the ‘hierarchy’ help us here? If we decide that anything in the ‘protect’ column is a ‘last resort’ because it falls into ‘PPE’ then we might give more priority to individual protection, in this case to the work restraint device. There is no single correct answer to this, which is why we need to see the whole menu and understand our own risk ‘dietary requirements’ before we choose.
11.8 Layers of controls
Once we have the full menu, we don’t (usually) choose just one item. With a restaurant menu you might choose a starter, main course and dessert, or you might choose between rice and noodles, and add a selection of main and side dishes. So in safety we choose multiple controls, trying to prevent harm in multiple ways.
Many readers will be familiar with James Reason’s ‘Swiss cheese’ model, but I’ve included a summary in Box 11.3. Reason’s cheese model illustrates how blocking holes in each layer makes the final accident less likely. Like any model, it isn’t perfect, but despite criticisms by ‘new view’ safety thinkers, it remains a useful way of reminding people of the dangers of relying on a single way of controlling risk. We will consider this in more detail in Section 11.9 when we return to the flowcharts we created in Chapter 3.
Box 11.3: Trajectory of an accident based on James Reason’s Swiss Cheese model
There have been multiple versions of this model over time, many with layers categorised as ‘latent failures’ and ‘active failures’, or ‘psychological precursors’ and ‘local triggers’. I’ve used a simple sequential variant of the model, with a timeline from planning through to an incident, with examples of controls that could have been in place on that timeline. A worker falls and is injured. A cursory investigation might suggest they fell over some deliveries because they weren’t paying attention. But working back through the layers we can see that there were multiple failures. If you think of these layers as constantly shifting, then for some of the time, those failures won’t line up – the poor planning that results in materials arriving at a busy time won’t lead to incorrect storage, or the incorrect storage will be picked up on an inspection and corrected, or the worker will spot the obstacle before they trip over. On the occasion where someone falls, there is nothing special about the circumstances – it just suggests an unfortunate alignment of the existing failures (or lack of controls).
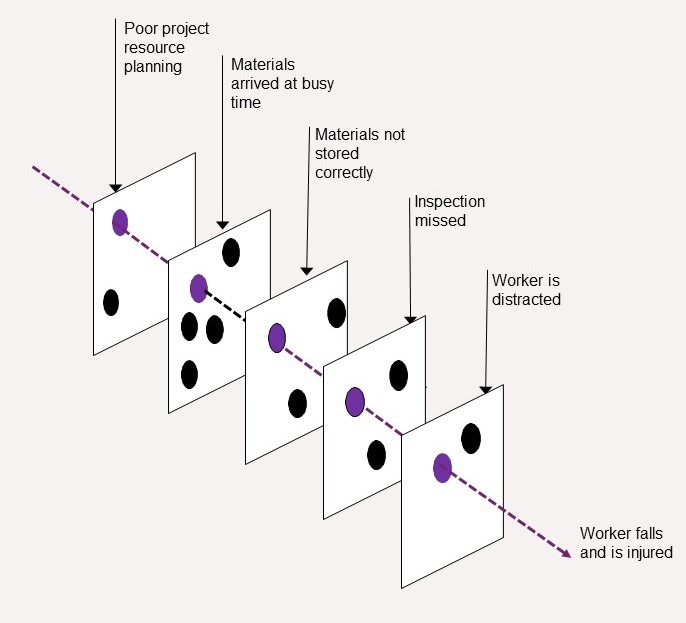
Too often, the focus returns to the worker – they should have noticed the obstacle and not tripped. But the idea of ‘layers of defence’ is that we look at every layer – as well as looking at the causes of distraction (perhaps they feel compelled to check their work email as they walk), how do we improve planning, storage and inspection?
11.9 Using our flowcharts from chapter 3
I presented some flowcharts in Chapter 3 to help us better understand our hazards. We’ll reuse these examples to identify relevant controls. If you created your own flowcharts apply the same process to those. While Box 11.3 showed just one way of a hazardous outcome occurring, the flowcharts sometimes show multiple routes can lead to the same event.
As I work through these examples, see whether the ‘hierarchy’ in Figure 11.3 or the other dimensions in Figure 11.4 prompt you to think of any more controls.
11.9.1 Fire
I’m starting with fire, because the controls are generally well-understood. I’ve added some controls (in orange) to the fire flowchart from Chapter 3.

Figure 11.5: Fire flowchart with layered controls
Looking at the left-hand side of Figure 11.5 we can see that we want to control sources of combustion, ignition and oxygen. This might include regular removal of combustible rubbish, appropriate storage of flammables and the management of ignition sources. While we need oxygen in the air, organisations using oxidisers or cylinders of oxygen need additional arrangements to manage these. Fire doors within buildings might also be part of a fire strategy to reduce the oxygen supply to fires once started.
The dark green boxes show the importance of early detection and alerting to reduce the spread of fire and to make sure people get away from danger as soon as possible. Controls include checking your fire alarm and all call points are working, that the emergency lighting will last long enough for people to escape on a dark winter evening, and that fire escape routes are kept clear.
You might know all of this already, as fire is a frequently assessed hazard. Finding this example ‘obvious’ will help you to understand the examples that follow. If this is less familiar to you, take a little more time to study the flowchart and think about the controls.
11.9.2 Slips and trips
As discussed in Chapter 3 the hazard is the thing that leaks or spills, or the obstacle left on the floor – the slip or trip is the event. Figure 11.6 shows where some layers of control are suggested by the flow diagram.

Figure 11.6: Slip and trip flowchart with layered controls
Working from left to right we can identify controls related to:
- The repair of known hazards, such as an uneven floor, a badly illuminated step, or a coffee machine that always leaks. The floor needs to be marked in the short term and fixed in the medium term; the step might need better lighting; the coffee machine could need descaling or replacing.
- Preventing future hazards, such as regular preventative maintenance and good housekeeping.
- Rapid detection, reporting and response to hazards. For example, does everyone know how to report a spill? Do cleaners have sufficient barriers to safeguard an area while they clean?
- Provision and use of handrails to prevent a fall if someone loses their balance. Supported by inspection and maintenance of the handrails.
- Provision and use of ‘appropriate’ footwear
- Manual handling activities (or people deciding to carry a laptop, phone, coffee and notebook to a meeting without the aid of a bag) which prevent people from using the handrail, or catching their balance?
- Identifying people who might be more prone to losing their balance.
Each box provides a prompt for a discussion that you should have with the people affected, to produce a more complete menu of control options.
11.9.3 Wellbeing and stress
If reading the fire and trips examples you’ve been thinking ‘but I already knew that – I would have come up with all those controls without the aid of a flowchart’ perhaps the next examples will convince you of the value of the flowchart.
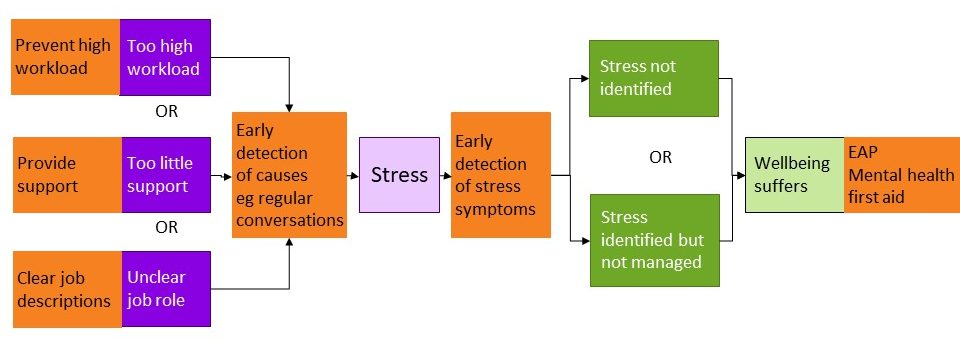
Figure 11.7: Wellbeing and stress flowchart with layered controls
Figure 11.7 has added controls to the flowchart we saw in Figure 3#fig33 Typical controls for stress start at the right-hand side of the flowchart – someone reports that their welfare is suffering, and they are given support, typically through an employee assistance programme (EAP) which is often contracted out to an external provider with little understanding and no control over anything the organisation might do to reduce the causes of stress. Mental health first aiders might be appointed to direct people to the help they need more quickly, although evidence for the value of this role is still lacking.
The flowchart reminds us to look for indicators of the precursors of stress – increasing workloads, lack of support (whether from managers, IT, procurement, or colleagues) and unclear job roles are just examples. See the box ‘HSE Management standards’ in Chapter 3 for more details.
11.9.4 Anger management
In Chapter 3 we considered the problems of violence towards staff from people waiting to discuss a claim for benefits. Jumping directly to the dark green boxes and identifying the claimant as the hazard, the obvious controls are engineering and administrative solutions – physical barriers between the claimants and the staff, along with an alarm system and people who can provide rapid support.
But working back through the flowchart we identified ‘anger’ as a risk factor, and considered three examples of hazards that contributed to that risk factor. Being kept waiting for an indeterminate period, when you are not sure whether the wait is going to be worthwhile makes it harder to be patient. This can be exacerbated if you perceive there to be any unfairness in the queuing system.
Figure 11.8 shows where other layers of control can be added.
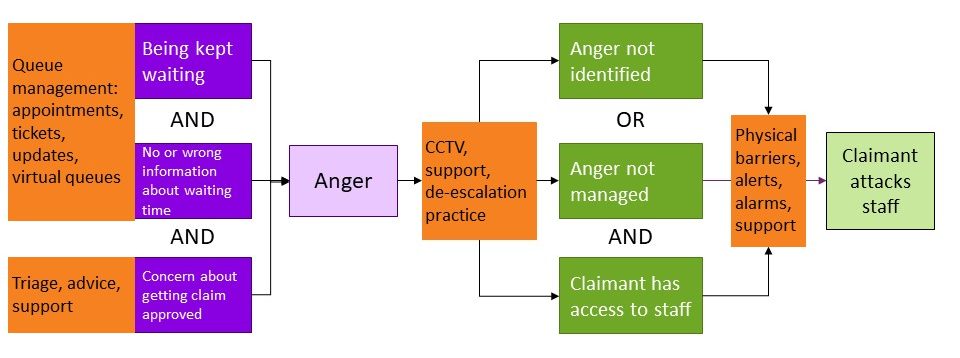
Figure 11.8: Anger flowchart with layered controls
It might not be practical to provide more staff to reduce waiting times, but does everyone need to stay in the waiting room while they wait? A quick triage when people arrive might reassure them that they will get the support they need, or direct them elsewhere quickly. If they need to wait, can they be given a time slot and a queue number? Perhaps an app can tell them where they are in the queue and they could go to a coffee shop or have a walk in the park until it’s their turn.
What is practical will have to be determined (see Chapter 12) but the flowchart helps us to generate a wider range of controls than a simple consideration of ‘violence towards staff’ would have done.
11.9.5 COVID-19
Before we look again at our COVID-19 flowchart from Chapter 3, let’s return to Table 11.1, where I asked you to suggest control measures given the hazards defined by the HSE in their COVID risk assessment template. Some typical responses are in Table 11.2
| Hazard as defined in risk assessment | Control measure |
|---|---|
| Getting or spreading coronavirus by not washing hands or not washing them adequately | Wash hands adequately |
| Getting or spreading coronavirus by not cleaning surfaces, equipment and workstations | Clean surfaces, equipment and workstations |
| Contracting or spreading the virus by not social distancing | Socially distance |
| Poor workplace ventilation leading to risks of coronavirus spreading | Provide workplace ventilation |
Table 11.2 Control measures given ‘negative’ hazards
There is nothing wrong with the control measures in Table 11.2. It was right that they should be in the menu of options – but this is a very limited menu for controlling COVID-19 which focusses on the right-hand side of our flowchart (and hence, the bottom levels of the hierarchy).
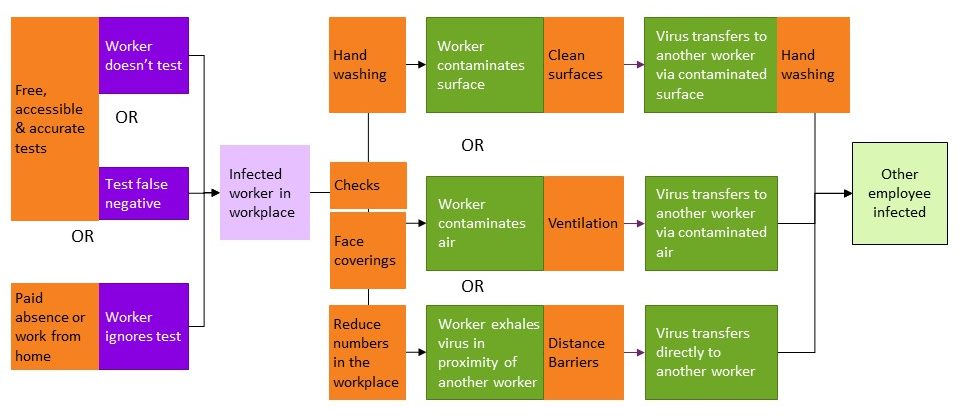
Figure 11.9: COVID-19 flowchart with layered controls
As shown in Figure 11.9, handwashing could reduce the likelihood that an infected worker contaminated a surface, and that a healthy worker, having touched a contaminated surface, transferred that infection into their respiratory system. Face coverings helped to prevent infected people from spreading the infection.
The hazard description ‘not social distancing’ might prompt an organisation to reduce the number of people in a workplace. For example, allowing staff to work from home or splitting two shifts into three. Customer-facing organisations such as supermarkets limited the number of customers allowed in the shop, with consequential queues outside to manage. But it didn’t prompt questions about alternatives to social distancing, such as physical barriers. Workers in factories had plastic screens between them, while shopworkers had screens between them and customers.

Socially distanced queue outside a supermarket in April 2020
Organisations needed to think about what other controls might prevent workers contaminating surfaces, the air or other workers, other than washing hands, cleaning surfaces and wearing face coverings. Would it help to re-organise the layout of equipment and walkways? Would different work processes or tools help? If workers normally shared tools or equipment, providing cleaners with their own broom, or maintenance staff with their own hammer and drill, could be a cost-effective measure to reduce reliance on sanitising hands and tools.
None of these controls or questions about controls are suggested by the hazards in Table 11.1 / 11.2.
Many organisations considered what checks could be made at the point people came to work. Some were reminded by a daily declaration to confirm that they had tested negative within some pre-determined time; other workplaces used temperature monitoring (although the effectiveness of this was questionable). The ‘critical control point’ of the time the infected worker arrives at work is clear from the flowchart, but isn’t even hinted at by Table 11.1.
Moving to the far left of the flowchart prompts us to think about why an infected worker would be in the workplace. Had they tested? How could we encourage people to test and to stay away from work if they test positive? Although tests in the UK were free during the peak period of Covid, people still had to remember to order them or find a pharmacy with a supply, and there were times that they were limited in stock. If a family of four needed to test every day, it is easy to see how they could run out, so perhaps providing tests to workers would help.
But the biggest factor for many workers, particularly those in less secure work, was that they wouldn’t get paid if they didn’t come to work, or they would receive only statutory sick pay (SSP). If SSP wasn’t enough to pay the bills, or there was no money without work, there is an obvious problem. Some companies might argue it was not ‘practical’ or affordable to pay more to people absent from work, but they needed to make that decision with their eyes open, aware of the impact it would have on that key event in light mauve – the infected worker present in the workplace.
Ask yourself:
Vaccination became an important and essential control in our menu of options to manage COVID-19. Where would you put this on the flowchart?
Don’t make the mistake of putting ‘unvaccinated worker in the workplace’ as the hazard. The lack of a vaccination makes them more susceptible (so could perhaps go on the right side of the flowchart), but it is only if they are infected that they (or the virus they carry) is a hazard.
11.10 A recap: What we’ve done so far
I’m not suggesting you’re going to create a formal flowchart for every risk assessment you ever do. But creating a few, even on the back of an A4 envelope, will help you to start thinking about how to build systems of controls. If a team are stuck in a rut over a risk assessment, and need a tool to promote new ideas, create a flowchart together at a workshop. If accidents keep happening even though you think the risk assessment is ‘fine’, create a flowchart to find out what could be improved. It’s about a way of thinking rather than a way of documenting. Thinking about the flow of events will help to you create more options for your menu.
To optimise our controls we need to have applied the lessons of earlier chapters as shown in Box 11.4
Box 11.4: A recap - lessons of earlier chapters
Chapter 1 – Identify hazards in sufficient detail – we can’t control what we haven’t defined.
Chapters 2 and 3 – Understand and describe relevant tasks, substances, equipment and tools, and the interactions between things and people. Without understanding, we can identify the hazards.
Chapter 4 – Consider how the hazard will impact different people.
Chapter 5 – Be prepared to repeat the identify – assess – control loop.
Chapter 6 – Check that we know and comply with the legislation that applies to the hazards in our workplace. Compliance on its own is not enough, but it can’t be risk-assessed out of our control system. We should also be aware of best practice and what is expected by the regulator beyond legal compliance.
Chapter 8 – Write descriptive harm statements for each hazard identified
Chapters 7, 9 and 10 are there to argue that the numbers aren’t going to help you as much with the next stage as you might previously have thought, but that a non-numeric grid such as the one in Figure 9.5 or Figure 10.10 can help you to prioritise more consistently across an organisation, provided the grid has been discussed and agreed.
Chapter 11 – Think about all the controls that might be possible to create a ‘menu’ from which you can choose. Just as Chapters 2, 3 and 4 encouraged you to be systematic in identifying hazards and who would be harmed, so this chapter encourages you to be systematic in identifying possible controls.
11.11 Choosing from our menu
Box 11.5 provides a summary of questions we could ask to produce our menu of possible controls.
Box 11.5: Questions to prompt
1. Have I noted the requirements of relevant legislation, plus best practice as outlined in guidance from regulators, industry bodies and academia? See Chapter 6 and Section 11.3
2. Have I used my ‘hierarchy’ or ‘general principles’ to trigger different options for controls? See Section 11.6. For example:
- How could I eliminate this hazard?
- How could I reduce the risk from this hazard at source?
- Are there any physical / engineering barriers that might work?
- What administrative controls (signs, procedures, training) are there, and could any be improved or enhanced?
- Is PPE relevant to this hazard? If so, how is this currently managed and what could we do better? What administrative controls do I need to make sure the right PPE is purchased, provided, stored, maintained and replaced? What training is needed to make sure that people know how to use PPE effectively?
3. Have I considered prevention and protection? See Section 11.7. For example:
- Is there anything else we could do to prevent this situation arising?
- If it arises, is there anything else we could do to protect people, or to prevent the situation getting any worse?
4. Have I considered collective and individual controls? See Section 11.7. For example:
- Is there anything else we could do to protect more people?
- Is there anything else we could do to protect individuals?
- Are any individuals more susceptible, and do they need additional controls?
Following the guidance set out in this book will produce a much larger range of options on your menu. But rather like the restaurant where you are spoiled for choice because the menu runs to multiple pages, how do you decide which items to choose from the menu?
With food, you need enough to feel satisfied and meet your essential nutritional needs, but not so much that you blow your budget (whether for money, calories or sugar). As we’ll see in Chapter 12, making choices from our menu of controls is a similar process of balancing benefits with costs, while ensuring we meet our essential needs. We will return to the subject of ‘reasonably practicable’ and consider what ‘grossly disproportionate’ means.
You can use the Contact form to send me feedback. If you’d like to receive an email when I add or update a chapter, please subscribe to my ‘book club’ Alternatively, you can go back to the book contents page.
